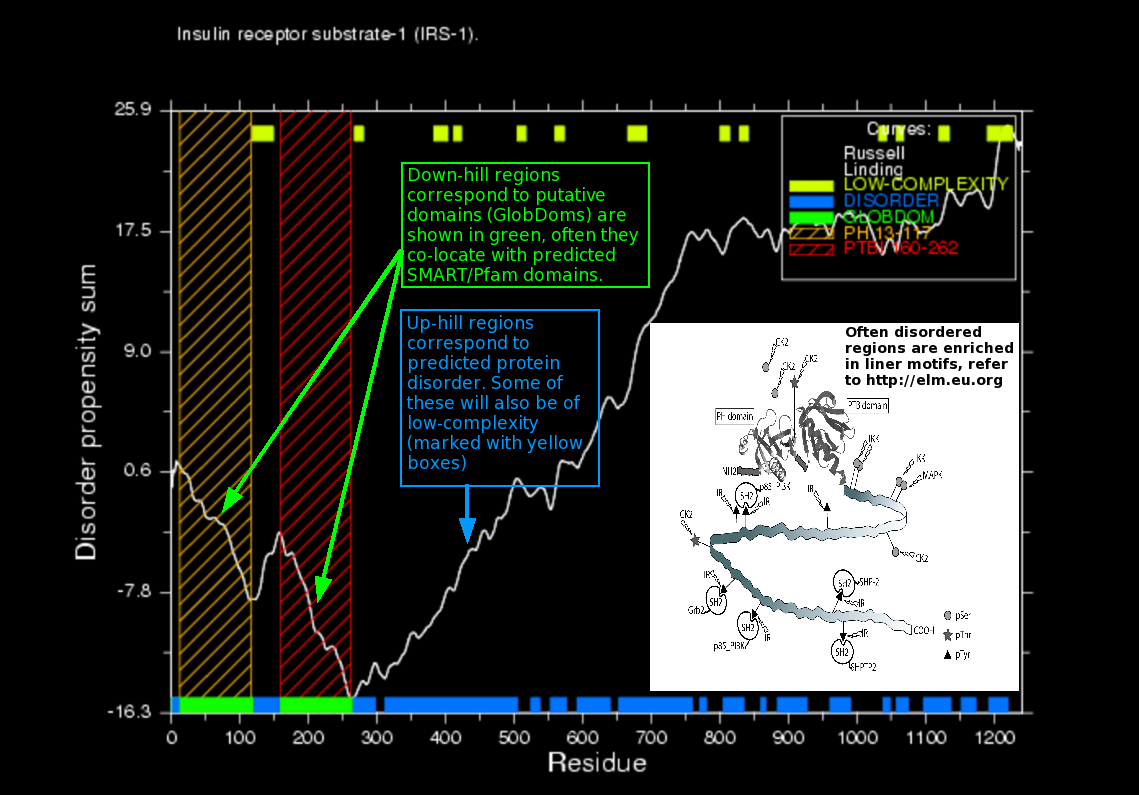
GlobPlot is a CGI (Common Gateway Interface) based server accessible at http://globplot.embl.de, for exploring disorder and globular segments (GlobDoms). By default the server will send the sequence to the public SMART queue, that by default also predicts Pfam domains) and display any obtained domain predictions as colored boxes layered on the graph. The SMART/Pfam prediction substantially increases the plotting time, but is set to 'on' by default because it is a very informative feature. Showing the boundaries of known SMART domains in the sequence is of great value for navigating as well as analysing the globplot. The SMART predictions are used solely for graphical viewing, they are not used in the GlobPlot routine itself. In order to present a graph that is smoothed for digital noise, we use a digital low-pass filter based on Savitzky-Golay (least-square fitting). The user can obtain the non-smoothed curve, as well as change the window length used by the Savitzky-Golay algorithm, however normally the default settings for the smoothing are optimal. In order to give the user the possibility for further data analysis the numerical data for the plot can be downloaded in tabulated format from the result page and used in other plotting software such as Grace, OpenOffice.org or Excel. Because GlobPlot is "scale stable" the user can paste in a specific sub sequence and obtain a zoomed plot. The output file format for the plot is PNG (Portable Network Graphics), but publication quality plots can be created using the Postscript option. Residue ranges for found disordered segments and globular regions (GlobDoms) are shown at the bottom of the output page.
GlobPipe is a pipeline that can be used for proteome scale analysis. The pipeline software is not a complete package but rather a set of routines that performs tasks relevant for SQL driven datamining large amounts of data in a relational database (PostgreSQL, www.postgresql.org). GlobPipe is still under development but it should be possible for any user with some programming skills to set up their own pipeline analysis, using these routines. We expect to set up a database of disordered protein sequences based on GlobPipe predictions. The full GlobPlot/GlobPipe package (excluded the DISLIN and TISEAN modules that both have to be obtained on their respective websites) can be downloaded as a tarball at [http://globplot.embl.de/download.html]. The software is released under the Academic Free License Version 1.2 and is thereby OSI Certified Open Source Software ([http://www.opensource.org]).
The web interface is fairly straight forward to use, the user can paste a sequence or enter the SWISS-PROT/SWALL accession (e.g.. P08630) or entry code (e.g. PRIO_HUMAN). DisEMBL fetches the sequence and description of the polypeptide from an ExPASy server using Biopython.org software.
Normally the default parameters should not be changed. If the query protein sequence is very long, >1000 residues, you can download the predictions and use a local graph/plotting tool such as Grace or OpenOffice.org to plot and zoom the data. Having identified the potential disordered regions, you should now have a good basis for setting up expression vectors and/or comparing the data with obtained structural data. We encourage any feedback on success/failures in deploying DisEMBL in structural analysis of proteins!
The sequence to be predicted must be specified in one of two ways:
As the GlobPlot prediction method is independent of sequence context, predictions on fragments of long sequences are safe. This is not the case with DisEMBL.
GlobPlot has a four parameters that can be fine tuned by the user. Except from increasing the Savitzky-Golay smoothing frame for long proteins, these parameters should generally be left at their defaults.
Once you have specified the sequence (and possibly changed parameters) simply press the "GlobPlot NOW!" button to get the prediction results.
We describe protein disorder as two-state models where each residue is either ordered or disordered. For this purpose we used three different criteria for defining which residues are disordered:
To interpret the predictions it is crucial to keep in mind that the three predictors are not all predicting the same kind of disorder. Agreement between the predictors should thus not be expected.
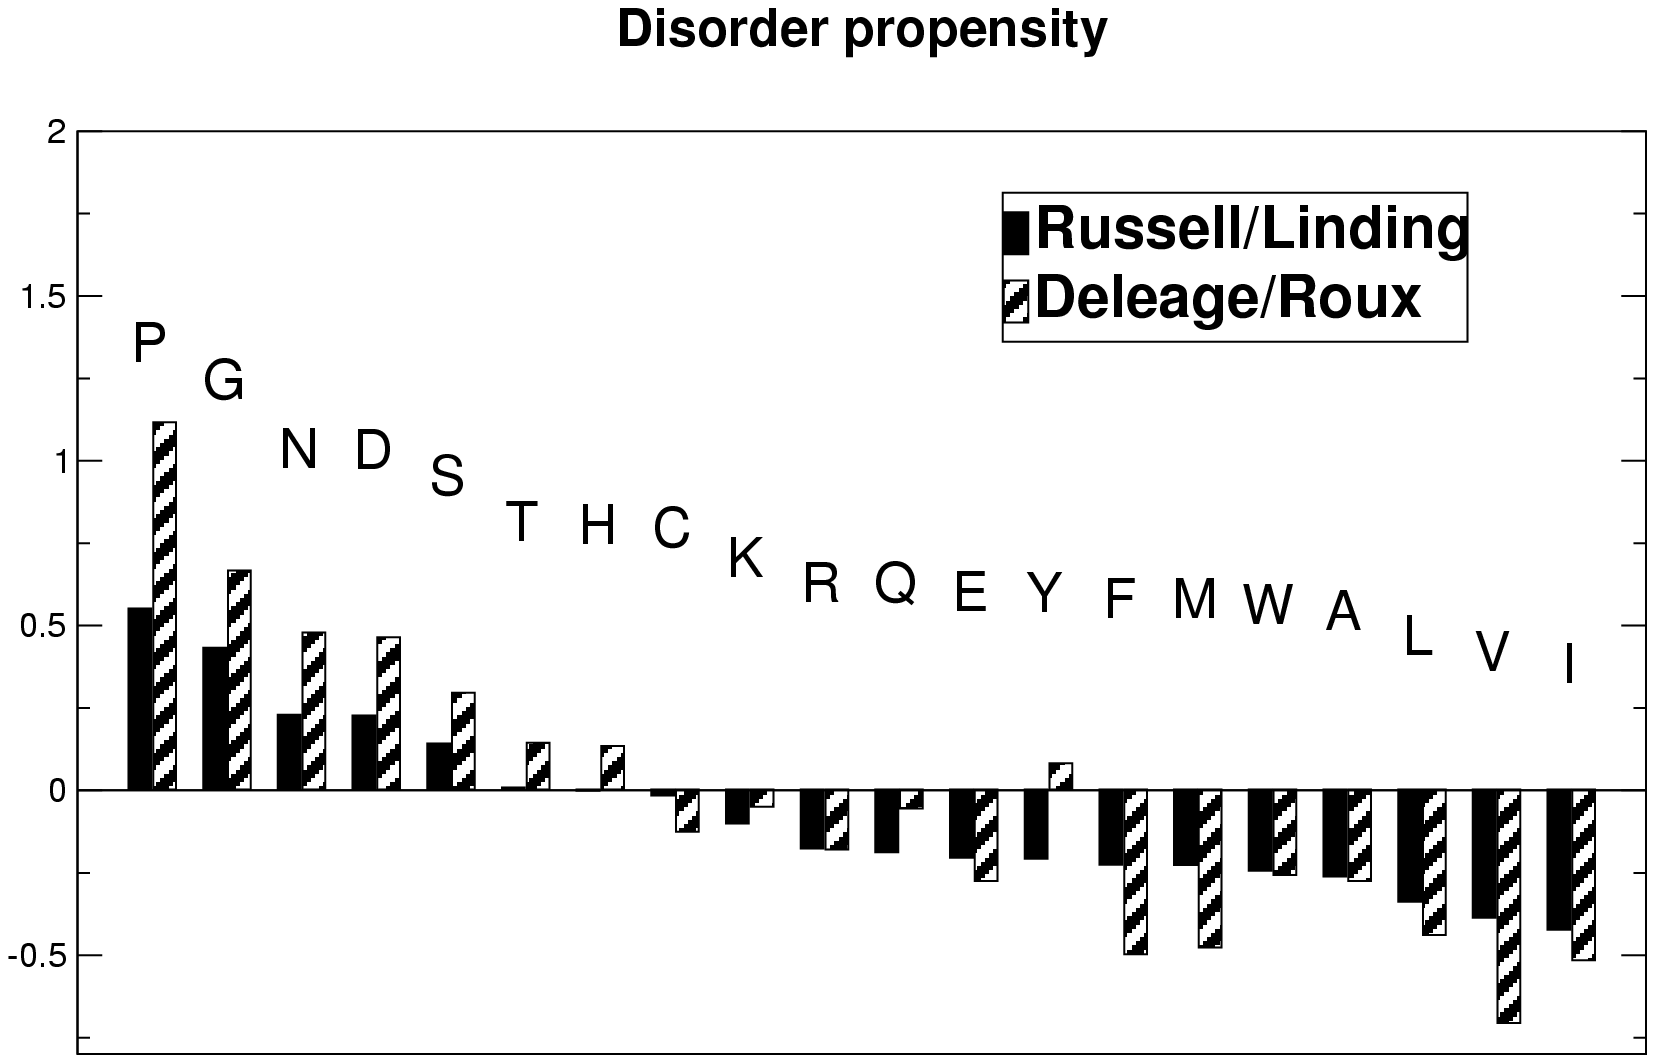
GlobPlot uses a propensity scale based on analysis of the SCOP database (refer to the paper), the Russell/Linding scale is shown
in the plot below, which also include a much older and obsolete scale for finding 'random-coil'. Please refer to the
old server pages and the paper for more details on the different
scales, in general we recommend to use the Russell/Linding scale.
If you want to run GlobPlot on large numbers of sequences, using the web interface is not the optimal solution. A much better option is to download the GlobPlot pipeline and install it locally. This allows GlobPlot to be deployed in a fully automated fashion on sequence files with arbitrarily many protein sequences.
The webinterface can also be used for large scale predictions, but please let us know if you want to do this. And always do it with moderation, i.e. one job per 10 secs or so. The way to automate is by submitting jobs like this:
http://globplot.embl.de/cgiDict.py?key=process&SP_entry=PRIO_HUMAN or http://globplot.embl.de/cgiDict.py?key=process&sequence_string=SEQ
where SEQ and PRIO_HUMAN can be replaced.
If you need further help please contact Rune Linding.